There are several programs
that allow the inspection and manipulation of 3-D structural protein data. In
this course we use the swiss protein data bank viewer, and to a lesser extend
chime, an add-on to Netscape, that allows viewing 3-D structures.
SPDBV is an excellet
choice, because it also provides an interface to the Swiss Protein databank
modeling software.
These are several excellent
on-line tutorials available to learn the use spdbv:
The basic tutorial at
http://www.usm.maine.edu/~rhodes/SPVTut/index.html
And a course on structure, spdbv, and modeling
http://www.expasy.ch/swissmod/course/course-index.htm
The exercise in this section is
taken with slight modifications from Gale Rhode's the basic tutorial, many of
the exercises in the following sections parallel exercises in the basic
tutorial.
You can retrieve pdb files from the
NCBI, or from the protein structure data
bank at Rutgers University. (To do so search for the file, click the explore
link and right click on the link that indicated download uncompressed pdb
file.) (The ones used in the course
are also available here).
Do the following:
Start
SPDBV
load
1HEW.pdb (hit return)
click
the right mouse buttom
click
on the three cursor control buttoms and rotate/move/enlarge lysozyme picture
click
on the page icon and go through the pdb file
open
the control window (DISPLAY-menu).
open
the align window (DISPLAY-menu)
select
all
display
Ramachandran plot
in
the control window select different residues
select
all
Explore
different coloring (CPK, secondary structure, accessibilty) and display options
(show CA trace only, show oxygen, …)
REMARK: If you do serious
work save your work periodically, sometimes it is impossible to recover from
inadvertent mouse clicks)
Select
(left mouse bottom at the buttom of the control panel) the NAG inhibitor.
Color
CPK
Invert
selection
Color
secondary structure
Invert
selection
Tools
calculate H-Bonds
right
click side column to turn off sidechain display
select
Neighbors of selected aa
hit
return
click
right mouse bottom on side header in control panel (acts only on selected
residues)
select
group properties Non-polar aa
click
on Header COL in display panel select blue color to color hydrophobic residues
blue
Are
there “blue” residues interacting with the N-Acetyl glucosamines? How come?
Play
around, if in doubt use the ? buttom.
The
worst that can happen is that you'll have to restart your computer.
Open
the alignment window and display the complete lysozyme molecule. Observe the color change in the structure
that happens when you move the mouse over the sequence in the alignment window.
The
resulting display after some beautifications might look like this:
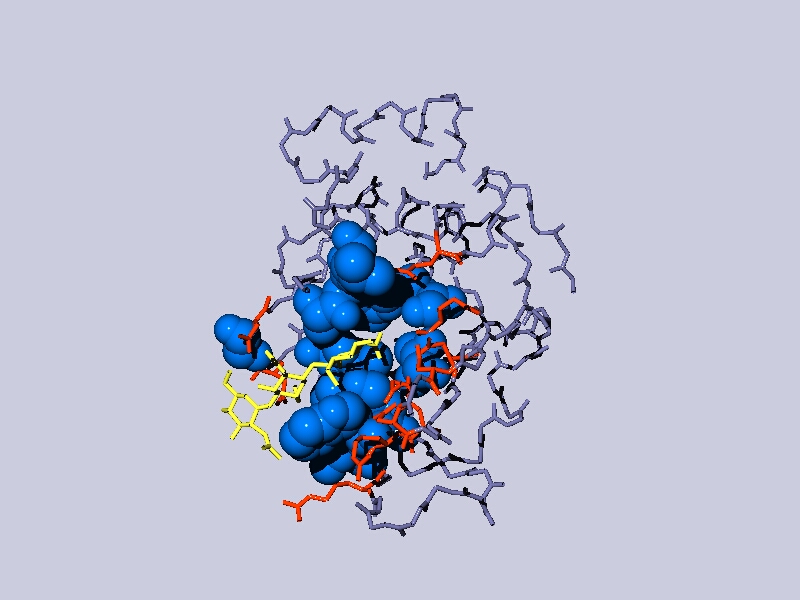
yellow:
the NAG inhibitor;
blue: residues in the binding pocket that are non-polar, depicted as space
filling balls;
red: other amino acids in the binding
pocket;
gray: the rest of the Lysozyme molecule, but only the backbone.
Other
things to try:
3D rendition (in the display menu),
slab view (shift and mouse move the slab),
explore the make up of the pdp file (text icon below the cursor
control),
have a look at the opening control window (upper left icon below
the cursor control).
If
you right click on a residue in either the alignment window or the control
window, the display centers on this residue.
Control
and mouse click adds residues to the list of selected residues (works in either
window)
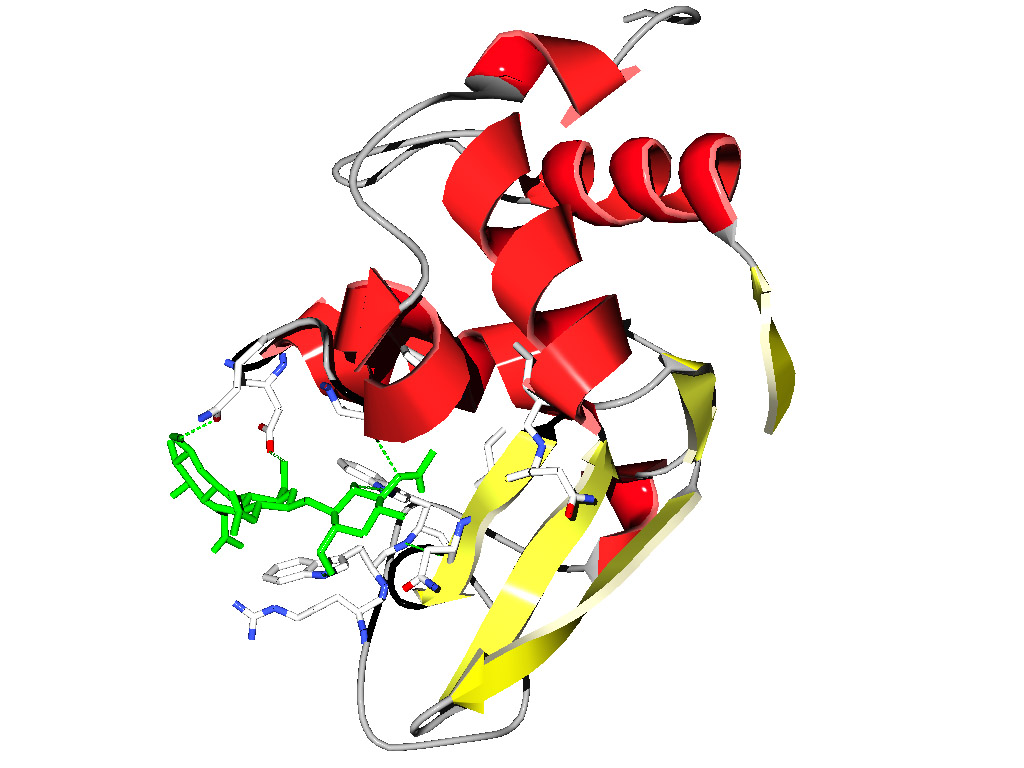
Can
you obtain a figure similar to the one below?
Go to the control panel click on the little black triangle to the right of
the col column and select color ribbon, then secondary structure in the color
menu. Display ribbon in the control panel, remove the other displays .....